

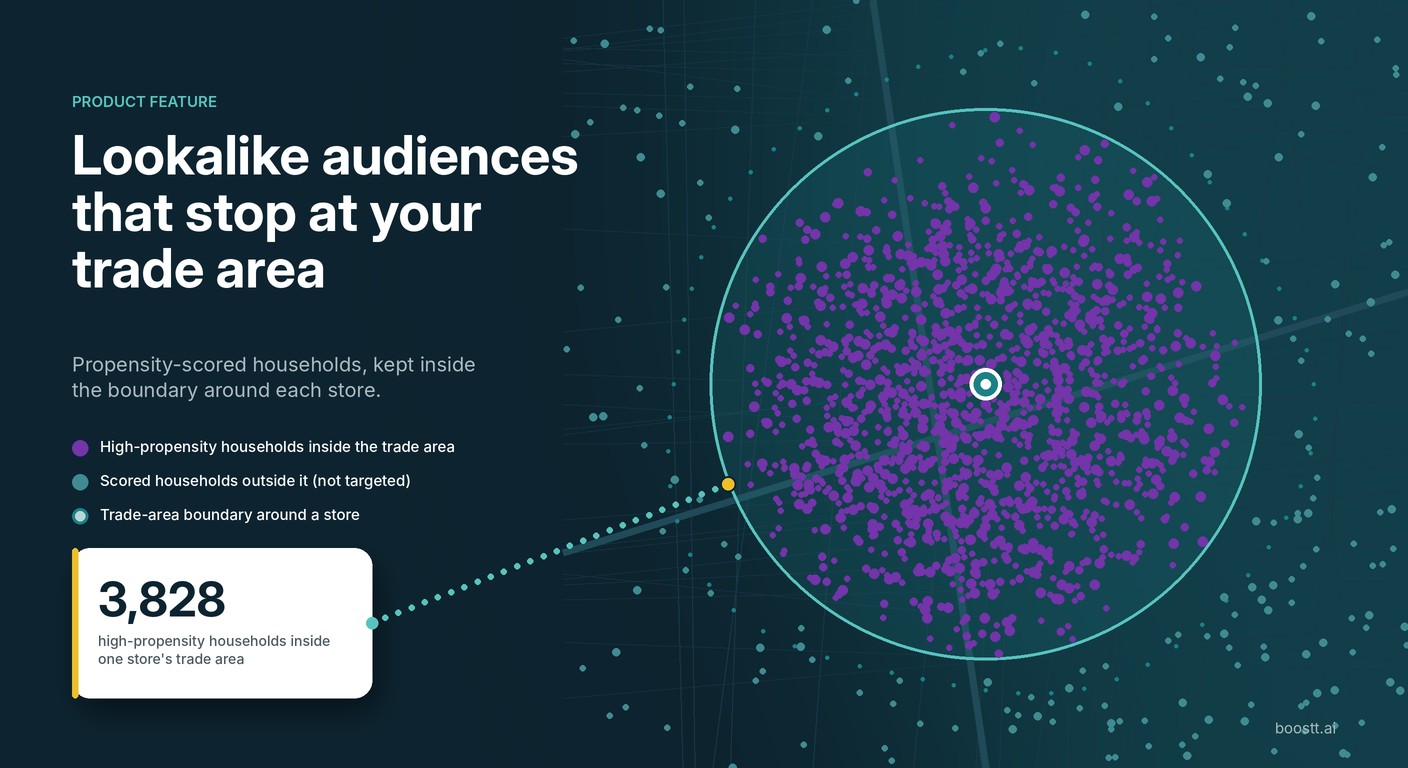

Most lookalike audiences find people who look like your buyers. Very few check whether those people can actually reach your store. Here is how we combine propensity scores with trade area boundaries so consumer brands stop paying for direct mail and digital impressions on households they cannot serve.
A consumer products brand sold through Sam’s Club came to us with a product launch problem. New SKU, a limited launch budget, and a constraint most growth teams never write down: the product only exists on shelves in specific clubs. Any household they reached that did not live within driving distance of one of those clubs was wasted money.
That constraint is the normal condition for most consumer businesses. Retailers sell where they have stores. Home services companies serve where their trucks can reach. Clinics, gyms, dealerships, restaurants and franchises all live inside a drive time. Yet most audience tools were built for brands that ship anywhere, and they will happily hand you a lookalike audience spread across all fifty states.
We built Predictive Prospecting Lookalikes to fix that. It answers two questions at once: who is most likely to buy, and can we actually serve them from here. Only households that pass both tests make it into the audience.
Audience intelligence tells you who. Location intelligence tells you where you can win. Growth lives in the overlap.
- Trade area
- The geographic zone around a store or service location from which it can realistically draw customers, drawn as a radius or a drive-time polygon.
- Lookalike audience
- Prospect households selected because they resemble your existing customers on the traits a model found predictive.
- Propensity score
- The model’s probability that a household will take the target action, such as buying the new product.
- Propensity percentile
- A household’s rank among everyone scored. Percentile 90 means it scores higher than 90 percent of the universe.
- Geo-bounded lookalike
- A lookalike audience that only includes households inside a defined trade area.
Why lookalike audiences fail brands that sell through stores
A standard lookalike audience takes your customer list, finds the common traits, and returns a large list of households that share them. That is useful. It is also blind to the one variable that decides whether a physical business can convert anyone: distance.
The cost shows up in three places.
- Wasted reach. You pay to put a mail piece, an ad or a call in front of a household that would need a two-hour drive to buy. They will not. The spend is gone.
- Polluted measurement. When half your lookalike audience sits outside your trade area, response rates look worse than they are, and you draw the wrong conclusions about creative, offer and channel.
- Store-level blindness. Launch budgets get allocated by region or DMA, not by actual demand around each location. The clubs with the most high-propensity households nearby get the same treatment as the ones with almost none.
Geofencing vs lookalike modeling: why neither works on its own
Geofencing solves the distance problem and ignores propensity. Draw a five-mile radius around a store, mail everyone inside it, and you have reached every household in the circle, including the large majority who will never buy the product. Saturation mail works this way, and its economics show it.
Lookalike modeling solves the propensity problem and ignores distance. The fix is not to pick one. It is to run both against the same list, in the right order.
What a trade area is, and why your marketing should stop at it
Retail real estate teams have used trade area analysis for decades to decide where to open stores. Marketing teams rarely borrow the idea, which is strange, because the same boundary that justifies a location also defines who that location can sell to.
A trade area can be drawn two ways. A radius is a circle of a fixed distance around the store. A drive-time polygon follows the roads, so it bends around rivers, highways and whatever else gets in the way. Radius is fast and works well in flat, grid-like suburbs. Drive time is more accurate where geography is messy. We support both, and most brands start with a radius per store and refine to drive time once they see how response falls off with distance.
Either way, the boundary does one job in a campaign: it decides which scored households are allowed to receive spend. Everything outside the line is cut before a dollar moves.
How predictive prospecting works: propensity scores, percentiles and boundaries
Audience intelligence
A propensity model trained on the brand’s own customers, not an industry template.
- Learns from who already bought
- Scores every prospect household
- Returns a percentile, so you choose the cut
Location intelligence
Trade area boundaries drawn around every store, club, clinic or service zone.
- Radius or drive-time boundaries
- Household counts per location
- Nothing outside the line gets spend
We take the brand’s historical customer and conversion records and build a propensity model specific to that brand. No generic vertical model, no borrowed segments. The model learns what your buyers have in common.
Every household in the target market gets a propensity probability and a percentile rank. Hover any household on the map and you see its own score. In the Sam’s Club launch below, qualifying households all ranked at percentile 87 or above, the top 13 percent of everyone scored.
Each store, club or service area gets a boundary on the map, by radius or drive time. The platform counts how many high-propensity households fall inside each one, so you can see demand store by store before spending anything.
The geo-bounded audience goes out through direct mail, addressable digital, email, SMS or AI voice, with a holdout. Because the audience is tied to stores, lift reads at the store level too, and every result feeds the next round of scoring.
The Sam’s Club product launch for a consumer products company, on the map
Below is the live view from the platform for the Houston market. Here is how to read it.
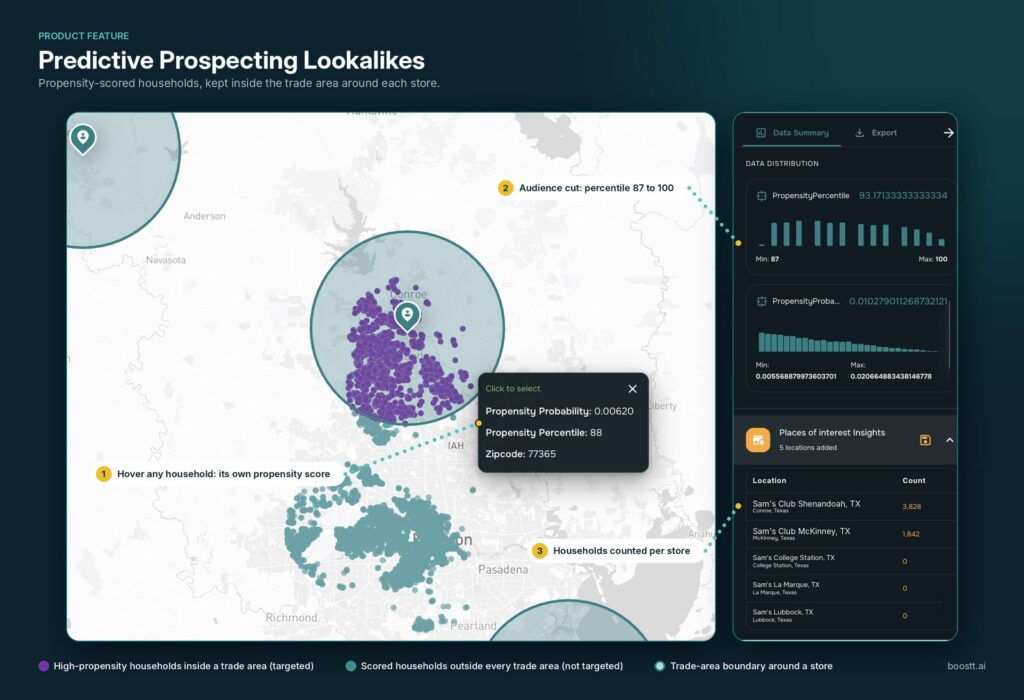
Boostt AI geospatial view for a Sam’s Club product launch. Purple: high-propensity households inside a trade area (targeted). Teal: scored households outside every trade area (not targeted). Hover any household to see its propensity score; the data panel shows the percentile distribution and the count per store.
The purple dots are high-propensity households that fall inside a trade area. They are the launch audience. The teal dots are households that also scored well but sit outside every boundary in the launch plan. They stay on the map so you can see what the model found, and they receive nothing. The shaded circles are the trade areas drawn around each Sam’s Club the brand wanted to support.
Look at the Shenandoah club north of Houston. The model found a dense cluster of high-propensity households, and almost all of them sit inside the boundary. The households who look most like the brand’s buyers live in the suburban corridor that club serves. Location and propensity reinforce each other, and the campaign can concentrate budget exactly where both are high.
Now look at the Houston core. There is a large mass of well-scored households there, and no club in the launch plan to serve them. A national lookalike would have mailed all of them. With trade area boundaries in place, they never entered the audience. That budget goes to Shenandoah and McKinney instead, where the shelves are.
Reading the data panel: percentile, probability and store-level counts
The right-hand panel is where the audience gets decided. The propensity percentile distribution shows the audience runs from percentile 87 to 100, so only the top 13 percent of scored households are in play. The propensity probability distribution shows the raw scores behind those ranks, highest at the left and tapering off, which is what a well-separated model looks like. Below that, the places of interest table counts how many qualifying households sit inside each store’s trade area.
| Location | High-propensity households in trade area |
|---|---|
| Sam’s Club, Shenandoah TXConroe, Texas | 3,828 |
| Sam’s Club, McKinney TXMcKinney, Texas | 1,842 |
Why location intelligence plus audience intelligence lowers acquisition cost
When every household in the audience is both likely to buy and able to buy, three things happen at once.
Customer acquisition cost drops. You stop paying for the portion of a lookalike audience that was never going to convert. For a store-dependent brand, that portion is usually the majority of a national list.
Retail velocity becomes targetable. For a CPG or consumer brand launching through a retailer, the number that matters is sell-through at specific locations. Store-level audiences let you drive demand into the exact clubs where the product needs to move, and read the result club by club.
Intelligence compounds. Each campaign produces new conversions inside known boundaries. Those feed back into the model, the next scoring round gets sharper, and the counts around each store become a live demand map rather than a one-time estimate.
Geofencing without propensity reaches everyone nearby. Propensity without geography reaches everyone who looks right. You need both, in the same list.
Who geo-bounded lookalike audiences are built for
Brands sold through retail
CPG and consumer products launching or expanding in specific chains or clubs. Drive demand into the stores that carry you.
Multi-location retailers
Stores, showrooms and dealerships that need prospecting audiences sized and bounded per location.
Home and field services
Roofing, plumbing, HVAC, pest control, and anyone whose service area is a map, not a zip list.
Healthcare and wellness
Clinics, dental and vein practices, med spas and gyms that only convert patients and members within a drive.
What you need to get started
- Your customer or conversion history with addresses. The model is trained on your buyers, so this is the one input that cannot be skipped. A prospect file on its own cannot be scored.
- Your locations or service areas. Store addresses, a list of clubs, or service-zone polygons. We draw the trade areas from there.
- A channel plan and a holdout. We run the audience through whichever channels you want working together, and hold out a control so the lift is measurable.
Frequently asked questions
What is a predictive prospecting lookalike audience?
A list of households that have never bought from you but score high on a propensity model trained on the people who have. Boostt AI builds that model on each brand’s own conversion data rather than a generic vertical model, so the lookalike reflects your buyers, not an industry average.
How do lookalike audiences work for direct mail?
Your customer file is the seed. A model learns what those households have in common, scores every household in the prospect universe, and ranks them by propensity. You mail the top-ranked households first, suppress your existing customers, and hold out a control group so you can measure lift.
What is a trade area in marketing?
A trade area is the geographic zone around a store or service location from which it realistically draws customers. It can be drawn as a simple radius or as a drive-time polygon that follows real roads. Bounding a marketing audience by trade area keeps spend on households that can actually reach the store.
Drive time vs radius: which boundary should I use?
A radius is quick and works well in flat, grid-like suburbs. A drive-time polygon follows roads, rivers and highways, so it is more accurate where geography gets in the way. Boostt AI supports both, and most brands start with a radius per store and refine to drive time once they see response by distance.
What is the difference between geofencing and a geo-bounded lookalike audience?
Geofencing reaches everyone inside a boundary, regardless of how likely they are to buy. A geo-bounded lookalike audience applies a propensity model first and then keeps only the high-scoring households that also fall inside the boundary, so you reach the likely buyers near your store rather than every household near your store.
What is a propensity score and what does the percentile mean?
A propensity score is the model’s estimate of the probability a household will take the target action. The percentile is that household’s rank against all scored households. In the Sam’s Club launch shown here, the audience held households at percentile 87 and above, the top 13 percent of everyone scored.
What data does Boostt AI need to build the model?
Your historical customer or conversion records, with addresses, plus your store or service-area locations. The model learns from your own buyers, so a prospect file alone is not enough to score an audience.
Which channels can a geo-bounded lookalike audience be used in?
The same scored, geo-bounded audience can be pushed to direct mail, addressable digital, email and SMS, and AI voice follow-up, so every channel is working the same households inside the same boundary.
See your own stores on the map
Send us your customer history and your locations. We will show you how many high-propensity households sit inside each trade area before you commit a dollar of launch budget.