

Most marketers know segmentation matters. Predictive Segmentation is one approach that can help turn it into a budget decision their CFO will actually approve.
That’s the gap predictive segmentation closes. By combining propensity scoring with lift tables and expected value calculations, you can move from vague audience buckets to a precise, defensible framework that tells you exactly who to target, what to offer them, and which channels are worth the spend.
This post breaks down how to build that framework—from lift table basics to tiered treatment strategies—so segmentation becomes an operational system, not just a slide in your next campaign review.
Table of Contents
- What Is Predictive Segmentation?
- Lift Tables: The Foundation of Smarter Spend
- Expected Value: Turning Lift Into Finance-Grade Decisions
- Offer Strategy: Stop Discounting the Wrong People
- Channel Strategy: Match Expensive Inventory to High EV Tiers
- The Tiered Treatment Matrix: Making Segmentation Operational
- The Measurement Trap: Correlation Isn’t Lift
- From Segmentation to Budget Allocation
- Frequently Asked Questions (FAQs)
What Is Predictive Segmentation?
Traditional segmentation groups customers by behavior: cart abandoners, lapsed buyers, first-time visitors. Everyone in the group gets the same treatment. It’s simple, but it wastes money—because not all cart abandoners are created equal.
Predictive segmentation uses propensity scoring to rank individuals by their likelihood to convert. This shifts the core question from “What did they do?” to “What are they likely to do next—and is it worth the cost to reach them?”
That reframe changes everything. Suddenly, segmentation isn’t just a targeting tool. It’s a resource allocation system.
Lift Tables: The Foundation of Smarter Spend
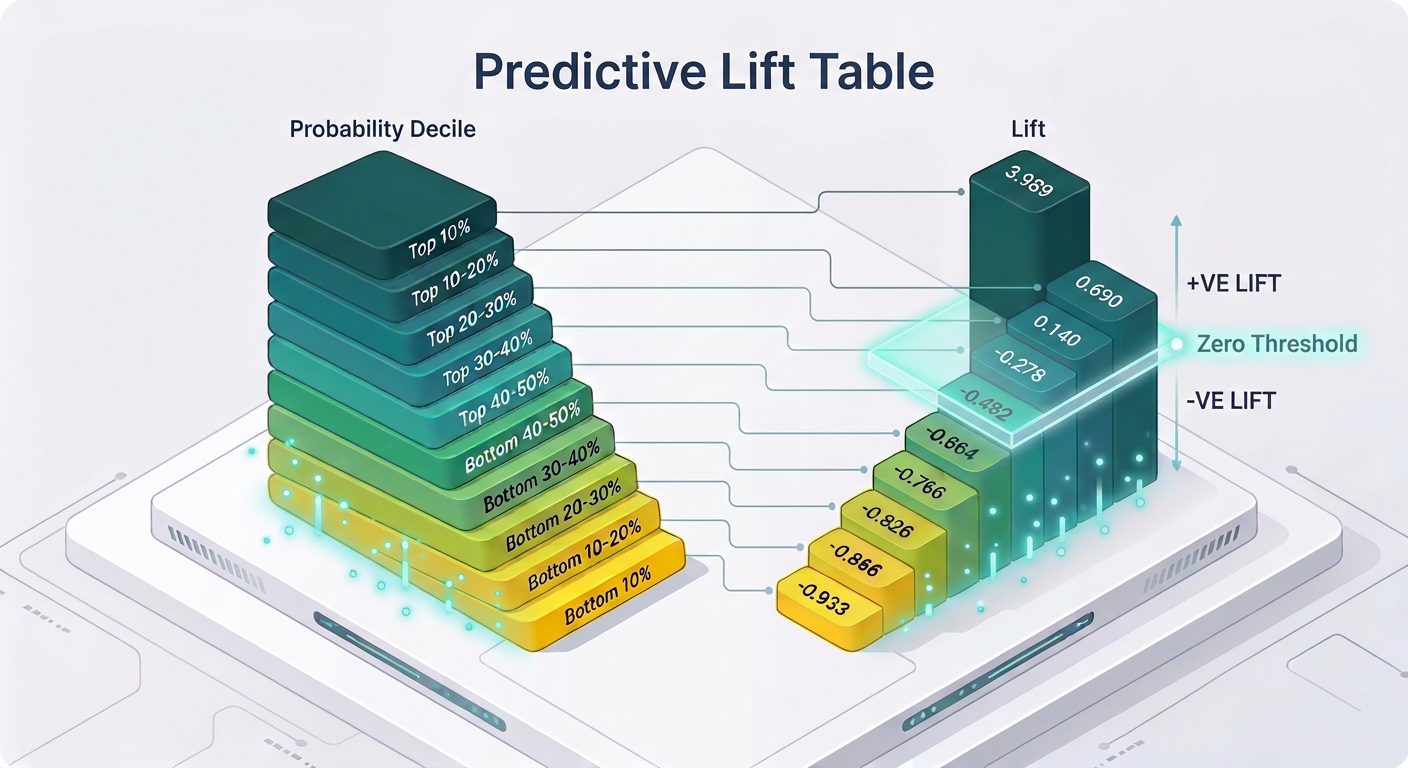
A lift table divides your scored audience into deciles (10 equal tiers by propensity score) and shows how each tier performs relative to the baseline.
Here’s a simple example:
- Top 10% converts at 0.59%
- Baseline average converts at 0.14%
- Lift = 4.2× over random
That 4.2× number isn’t a vanity metric—it’s a signal to change your treatment strategy. The goal of a lift table isn’t to celebrate the model. It’s to answer a practical question: who deserves your most expensive treatments, and who doesn’t?
How to use lift tiers in practice:
- High deciles → premium treatments (direct mail, CTV, personalized offers)
- Mid deciles → efficient touches (email, retargeting with frequency caps)
- Low deciles → suppression or low-cost awareness tests
This alone will reduce wasted spend. But to make the case to finance, you need to go one step further.
Expected Value: Turning Lift Into Finance-Grade Decisions
Expected value (EV) connects propensity scores to revenue outcomes in a language every CFO understands.
The formula:
EV = (conversion rate × value per conversion) – cost per contact
Example using the top decile:
- Cost per contact: $0.70
- Value per conversion: $1,500
- Conversion rate: 0.59% (0.0059)
Calculation:
- Revenue EV per contact = 0.0059 × $1,500 = $8.85
- Net EV per contact = $8.85 – $0.70 = $8.15
Run this calculation across every tier and you get a ranked list of audience segments ordered by financial return. That’s not a marketing argument—that’s a budget allocation framework.
Low EV tiers don’t disappear from your strategy. They shift to lower-cost channels or get suppressed entirely, preserving margin without abandoning reach.
Offer Strategy: Stop Discounting the Wrong People
One of the most overlooked costs in growth marketing is unnecessary discounting. When every segment gets the same incentive, you’re giving discounts to people who would have converted anyway.
Predictive segmentation fixes this by matching offer intensity to actual need:
- High propensity + high value → minimal or no incentive; focus on trust signals, social proof, and urgency
- Mid propensity → test small vs. medium incentives; let data decide
- Low propensity → suppress discount offers; run awareness or requalification instead
The result? You reserve budget for conversions that actually require a nudge—and protect margin on the ones that don’t.
Channel Strategy: Match Expensive Inventory to High EV Tiers
Once EV is calculated, channel selection stops being a gut call. It becomes rational.
Here’s how to think about it:
| Channel | Best fit |
| Direct mail | High EV tiers with deliverable household data + high LTV |
| CTV | High-value education and reinforcement cohorts |
| Scales across all tiers; adjust cadence and creative by decile | |
| Paid ads | Reinforcement and retargeting; apply strict frequency caps by tier |
Expensive channels like CTV and direct mail have real costs per contact. Deploying them against low EV segments is a guaranteed way to inflate CAC and underperform on ROAS. Reserve premium inventory for premium tiers—and let email and ads carry the mid and lower deciles efficiently.
For a deeper look at how to sequence these channels across the customer journey, see our guide to omnichannel sequencing patterns.
The Tiered Treatment Matrix: Making Segmentation Operational
This is where strategy becomes execution. A tiered treatment matrix maps each decile to a specific combination of channels, offers, and cadence. It transforms segmentation from a label into a policy.
Here’s a practical starting point:
- Tier A (Top 10%) → Direct mail + CTV burst + email sequence + retargeting
- Tier B (Next 20%) → Email + paid ads + optional direct mail test
- Tier C (Middle 40%) → Email nurture + retargeting with strict frequency caps
- Tier D (Bottom 30%) → Suppress or route to low-cost awareness only
Every time a contact is scored, they slot into a tier. Every tier has a defined treatment. No manual decisions, no one-size-fits-all flows. Just a system that scales.
The Measurement Trap: Correlation Isn’t Lift
Here’s the catch most teams miss: high-propensity segments will perform well even without treatment. They were already likely to convert.
If you attribute all of that revenue to your campaign, you’ll over-report impact and misallocate budget in the next cycle.
The fix is straightforward—but often skipped:
- Build holdout groups by tier. Withhold treatment from a portion of each decile and compare outcomes.
- Run structured incrementality tests. Measure the lift your campaign actually drove, not the lift your model predicted.
Without this, your segmentation reporting looks great on paper while your true incremental ROI remains unknown. For a full breakdown of how to structure these tests, see our guide to incrementality and matchback measurement.
From Segmentation to Budget Allocation
Predictive segmentation earns its place in the marketing stack when it changes how decisions get made. Not just who gets targeted, but how much you spend, what you offer them, and how you prove it worked.
The lift table is your starting point. Expected value connects it to finance. The tiered treatment matrix makes it operational. And holdout measurement keeps the whole system honest.
If you’re ready to put propensity scoring to work across your campaigns, explore how Boostt AI’s predictive analytics platform can help you build this framework—and scale it across every channel.
Frequently Asked Questions (FAQs)
What is predictive segmentation?
Predictive segmentation is a data-driven approach in marketing where customers are ranked and segmented based on their likelihood to convert, using propensity scores, rather than just past behavior.
How does a lift table improve marketing ROI?
Lift tables identify segments with higher propensity to convert, allowing marketers to prioritize spend and allocate more expensive treatments to high-value cohorts, improving return on investment.
What is expected value (EV) in segmentation?
Expected value in predictive segmentation calculates the projected profit or loss for each audience tier by factoring in conversion rates, revenue per conversion, and cost per contact.
How can I match offers to audience segments?
By using predictive segmentation, you can customize offer intensity and type based on actual conversion likelihood, reducing unnecessary discounting and maximizing profit margins.
Why are holdout groups important in measurement?
Holdout groups allow you to measure the true lift driven by your marketing campaigns by comparing treated vs. untreated cohorts, ensuring accurate reporting and informed budget allocation.